1. 설치
options(repos=c(RStudio='http://rstudio.org/_packages', getOption('repos')))
install.packages('shiny')
library(shiny)

runExample('01_hello')
runExample('02_text')
runExample('03_reactivity')
runExample()함수로 example 파일을 수행해볼 수 있다
2. 기본 사용 방법
워킹디렉토리 안에 ui.R과 server.R 파일이 들어있어야한다.
ui.R은 화면의 구성
server.R은 실제 R에서 구동시키는 코드들이 들어간다. ui.R에서 input, output을 받아와 출력시킴
3. hello_shiny
ui.R
library(shiny)
shinyUI(pageWithSidebar(
  headerPanel("Hello Shiny!"),
  sidebarPanel(
    sliderInput("obs",
                "Number of observations: ",
                min=1,
                max=1000,
                value=500)),

  mainPanel(
    plotOutput("distPlot"))
))
server.R
library(shiny)
shinyServer(function(input,output){
  output$distPlot <- renderPlot({
    dist<-rnorm(input$obs)
    hist(dist)
  })
})
코드 수행하기
library(shiny)
setwd('/cloud/project/hello')
runApp()
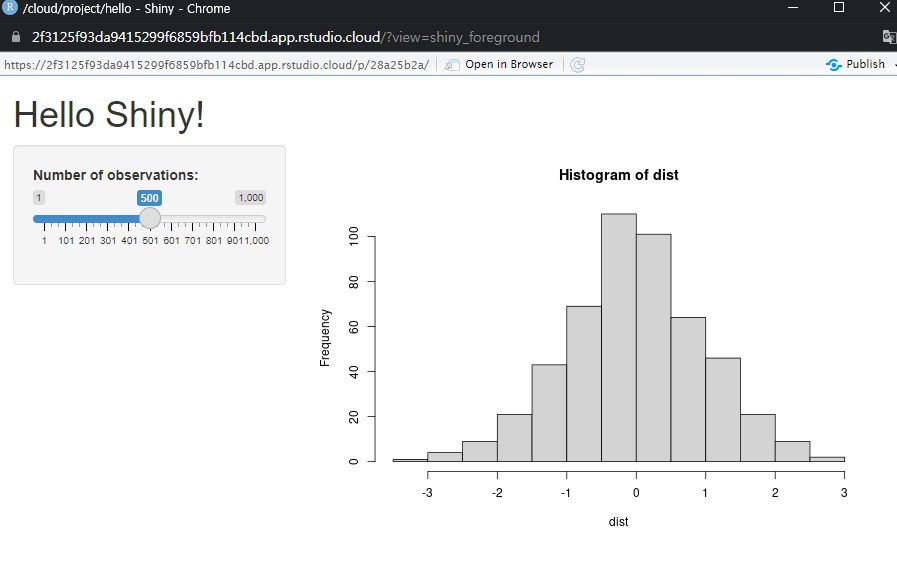
위 코드를 수행하면 창이 하나 뜨면서

4. miles per gallon
ui.R
library(shiny)
shinyUI(pageWithSidebar(
  headerPanel("Miles Per Gallon"),
  sidebarPanel(
    selectInput("variable","Variable: ",
                list("Cylinders" = "cyl",
                     "Transmission" = "am",
                     "Geers" = "gear")),
    checkboxInput("outliers", "Show outliers",FALSE)
  ),

  mainPanel(h3(textOutput('caption')),
            plotOutput('mpgPlot'))
))
server.R
library(shiny)
library(datasets)
mpgData <- mtcars
mpgData$am <- factor(mpgData$am, labels = c("Automatic", "Manual"))


shinyServer(function(input, output){

  formulaText <- reactive({
    paste("mpg ~", input$variable)
  })

  output$caption <- renderText({
    formulaText()
  })

  output$mpgPlot <- renderPlot({
    boxplot(as.formula(formulaText()),
            data = mpgData,
            outline = input$outliers,
            col = "#75AADB", pch = 19)
  })

})

outlier도 체크해서 보거나 체크 풀어서 안볼수도 있음
5. sliders
ui.R
library(shiny)
shinyUI(pageWithSidebar(

  # App title ----
  headerPanel("Sliders"),

  # Sidebar to demonstrate various slider options ----
  sidebarPanel(

    # Input: Simple integer interval ----
    sliderInput("integer", "Integer:",
                min = 0, max = 1000,
                value = 500),

    # Input: Decimal interval with step value ----
    sliderInput("decimal", "Decimal:",
                min = 0, max = 1,
                value = 0.5, step = 0.1),

    # Input: Specification of range within an interval ----
    sliderInput("range", "Range:",
                min = 1, max = 1000,
                value = c(200,500)),

    # Input: Custom currency format for with basic animation ----
    sliderInput("format", "Custom Format:",
                min = 0, max = 10000,
                value = 0, step = 2500,
                pre = "$", sep = ",",
                animate = TRUE),

    # Input: Animation with custom interval (in ms) ----
    # to control speed, plus looping
    sliderInput("animation", "Looping Animation:",
                min = 1, max = 2000,
                value = 1, step = 10,
                animate =
                  animationOptions(interval = 300, loop = TRUE))

  ),

    # Main panel for displaying outputs ----
    mainPanel(

      # Output: Table summarizing the values entered ----
      tableOutput("values")

    )
  )
)
server.R
library(shiny)
# Define server logic for slider examples ----
shinyServer(function(input, output) {

  # Reactive expression to create data frame of all input values ----
  sliderValues <- reactive({

    data.frame(
      Name = c("Integer",
               "Decimal",
               "Range",
               "Custom Format",
               "Animation"),
      Value = as.character(c(input$integer,
                             input$decimal,
                             paste(input$range, collapse = " "),
                             input$format,
                             input$animation)),
      stringsAsFactors = FALSE)

  })

  # Show the values in an HTML table ----
  output$values <- renderTable({
    sliderValues()
  })

})

6. tabsets
ui.R
library(shiny)
shinyUI(pageWithSidebar(

  headerPanel("Tabsets"),


  sidebarPanel(

    radioButtons("dist", "Distribution type:",
                 c("Normal" = "norm",
                   "Uniform" = "unif",
                   "Log-normal" = "lnorm",
                   "Exponential" = "exp")),

    # br() element to introduce extra vertical spacing ----
    br(),

    # Input: Slider for the number of observations to generate ----
    sliderInput("n",
                "Number of observations:",
                value = 500,
                min = 1,
                max = 1000)

  ),

    # Main panel for displaying outputs ----
    mainPanel(

      # Output: Tabset w/ plot, summary, and table ----
      tabsetPanel(
                  tabPanel("Plot", plotOutput("plot")),
                  tabPanel("Summary", verbatimTextOutput("summary")),
                  tabPanel("Table", tableOutput("table"))
      )

    )
  )
)
server.R
library(shiny)
shinyServer(function(input, output) {

  # Reactive expression to generate the requested distribution ----
  # This is called whenever the inputs change. The output functions
  # defined below then use the value computed from this expression
  data <- reactive({
    dist <- switch(input$dist,
                   norm = rnorm,
                   unif = runif,
                   lnorm = rlnorm,
                   exp = rexp,
                   rnorm)

    dist(input$n)
  })

  # Generate a plot of the data ----
  # Also uses the inputs to build the plot label. Note that the
  # dependencies on the inputs and the data reactive expression are
  # both tracked, and all expressions are called in the sequence
  # implied by the dependency graph.
  output$plot <- renderPlot({
    dist <- input$dist
    n <- input$n

    hist(data(),
         main = paste("r", dist, "(", n, ")", sep = ""),
         col = "#75AADB", border = "white")
  })

  # Generate a summary of the data ----
  output$summary <- renderPrint({
    summary(data())
  })

  # Generate an HTML table view of the data ----
  output$table <- renderTable({
    data()
  })

})

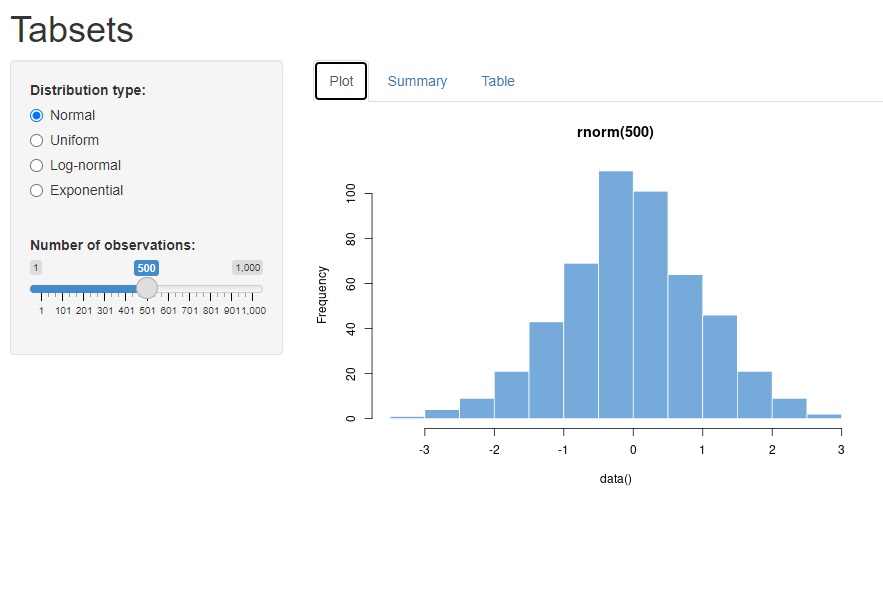
plot, summary, table을 보면서 확인하거나
distribution type을 바꿔보면서 분포도 다르게 볼 수 있다
7. datatable
ui.R과 server.R로 나눠서 코드를 관리하는 것이 효율적이지만 한번에 작성할 수도 있다
library(shiny)

runApp(list(
  ui=basicPage(
    h2('The mtcars data'),
    dataTableOutput('mytable')
  ),
  server=function(input,output){
    output$mytable = renderDataTable({
      mtcars
    })
  }
))

ui.R
library(shiny)
library(ggplot2)
shinyUI(pageWithSidebar(
  headerPanel("Examples of DataTables"),
  sidebarPanel(
      checkboxGroupInput("show_vars", "Columns in diamonds to show:",
                         names(diamonds), selected = names(diamonds)),

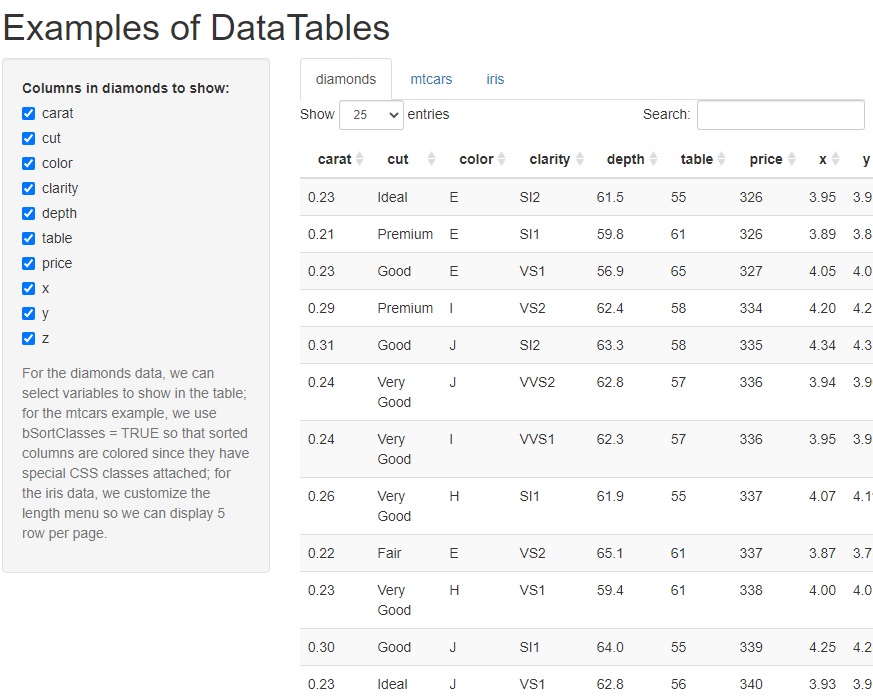
      helpText('For the diamonds data, we can select variables to show in the table;
               for the mtcars example, we use bSortClasses = TRUE so that sorted
               columns are colored since they have special CSS classes attached;
               for the iris data, we customize the length menu so we can display
               5 row per page.')
    ),
    mainPanel(
      tabsetPanel(
        id = 'dataset',
        tabPanel("diamonds",dataTableOutput("mytable1")),
        tabPanel("mtcars",dataTableOutput("mytable2")),
        tabPanel("iris",dataTableOutput("mytable3"))
      )
    )
))
server.R
library(shiny)
shinyServer(function(input, output) {

  output$mytable1 <- renderDataTable({
    library(ggplot2)
    diamonds[,input$show_vars,drop=FALSE]
  })


  output$mytable2 <- renderDataTable({
    mtcars
  },options=list(bSortClasses=TRUE))


  output$mytable3 <- renderDataTable({
    iris
  },options=list(aLengthMenu=c(5,30,50),iDisplayLength=5))

})

8. more widget
ui.R
library(shiny)
shinyUI(pageWithSidebar(
  headerPanel("More Widgets"),
  sidebarPanel(
    selectInput("dataset","Choose a dataset: ",
                choices=c('rock','pressure','cars')),
    numericInput('obs','Number of observations to view: ',10),
    helpText('Note: While the data view will show only the specified',
             'number of observations, the summary will still be based',
             'on the full dataset.'),
    submitButton('Update View')
  ),

  mainPanel(h4('Summary'),
            verbatimTextOutput('summary'),
            h4('Observations'),
            tableOutput('view'))
))
server.R
library(shiny)

shinyServer(function(input, output){

  datasetInput <- reactive({

    switch(input$dataset,
           'rock'=rock,
           'pressure'=pressure,
           'cars'=cars)

  })

  output$summary <- renderPrint({
    dataset <- datasetInput()
    summary(dataset)
  })

  output$view <- renderTable({
    head(datasetInput(), n=input$obs)
  })

})

7. uploading Files
ui.R
library(shiny)

shinyUI(pageWithSidebar(
  headerPanel("CSV viewer"),
  sidebarPanel(

    fileInput('file1', 'Choose CSV File',
              accept=c('text/csv','text/comma-sepearated-values,text/plain','.csv')),

    tags$hr(),
    checkboxInput('header','Header',TRUE),
    radioButtons('sep','Separator',
                 c(Comma=',',
                   Semicolon=';',
                   Tab='\t'),
                 'Comma'),

    radioButtons('quote','Quote',
                 c(None='',
                   'Double Quote'='"',
                   'Single Quote'="'"),
                 'Double Quote')
  ),

  mainPanel(
    tableOutput('contents')
  )
))
server.R
library(shiny)


shinyServer(function(input,output){

  output$contents <- renderTable({
    inFile <- input$file1

    if(is.null(inFile))
      return(NULL)

    read.csv(inFile$datapath, header=input$header, sep=input$sep, quote=input$quote)
  })

})

Browse 눌러서 파일을 업로드해서 확인
파일 형식에 따라 separator, quote, header 선택해서 볼 수 있음
8. downloading_Files
ui.R
library(shiny)

shinyUI(pageWithSidebar(
  headerPanel("Download Example"),
  sidebarPanel(

    selectInput("dataset", "Choose a dataset: ",
                choices = c('rock','pressure','cars')),
    downloadButton('downloadData','Download')),

  mainPanel(
    tableOutput('table')
  )
))
server.R
library(shiny)


shinyServer(function(input,output){

  datasetInput <- reactive({
    switch(input$dataset,
           'rock' = rock,
           'pressure' = pressure,
           'cars' = cars)
  })

  output$table <- renderTable({
    datasetInput()
  })

  output$downloadData <- downloadHandler(
    filename = function(){
      paste(input$dataset,'.csv',sep='')
    },
    content = function(file){
      write.csv(datasetInput(),file)
  })

})

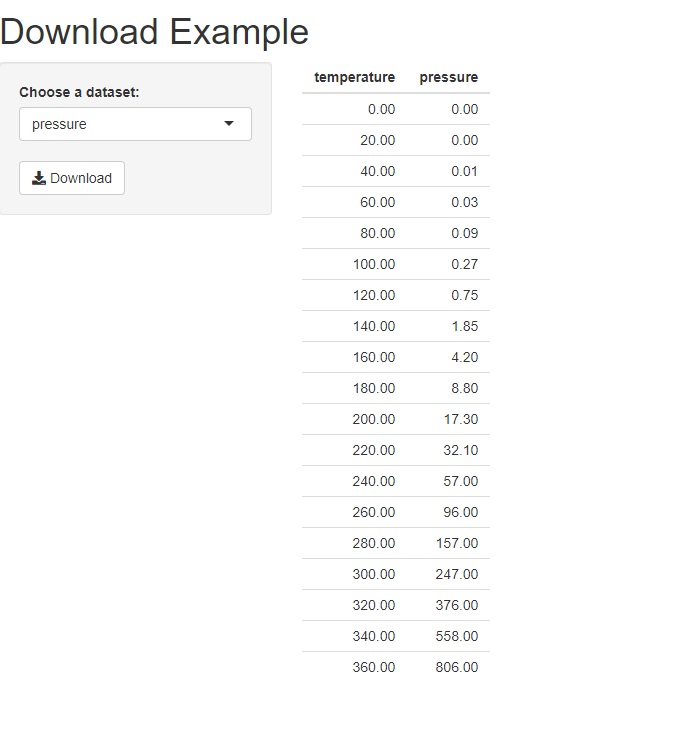
choose a dataset에서 rock, pressure, cars 중 하나 선택해서 볼 수 있다
실제로 download 누르면 다운로드 할 수 있다
9.html_ui
html 태그로 페이지 만들기
이 경우 ui.R은 index.html로 해줘야하고 server.R은 app.R로 해야한다
그리고 index.html은 www라는 폴더 이름에 만들어준다
그래서 워킹디렉토리 안에는 app.R과 www라는 폴더가 들어가있고
www 폴더 안에는 index.html이 들어가 있다
index.html
<!DOCTYPE html>
<html>

<head>

  <script src="shared/jquery.js" type="text/javascript"></script>
  <script src="shared/shiny.js" type="text/javascript"></script>
  <link rel="stylesheet" type="text/css" href="shared/shiny.css"/>
</head>

<body>
  <h1>HTML UI</h1>

<p>
  <label>Distribution type:</label><br />
  <select name="dist">
    <option value="norm">Normal</option>
    <option value="unif">Uniform</option>
    <option value="lnorm">Log-normal</option>
    <option value="exp">Exponential</option>
  </select>
</p>

<p>


  <label>Number of observations:</label><br />
  <input type="number" name="n" value="500" min="1" max="1000" />


</p>

<h3>Summary of data:</h3>
<pre id="summary" class="shiny-text-output"></pre>

<h3>Plot of data:</h3>
<div id="plot" class="shiny-plot-output"
     style="width: 100%; height: 300px"></div>

<h3>Head of data:</h3>
<div id="table" class="shiny-html-output"></div>

</body>
</html>
app.R
library(shiny)

server <- function(input,output){
  d <- reactive({
    dist <- switch(input$dist,
                   norm=rnorm,
                   unif=runif,
                   lnorm=rlnorm,
                   exp=rexp,
                   rnorm)
    dist(input$n)
  })

  output$plot <- renderPlot({
    dist <- input$dist
    n <- input$n

    hist(d(),
         main = paste('r',dist,'(',n,')',sep=""),
         col = '#75AADB',border='white')
  })

  output$summary <- renderPrint({
    summary(d())
  })

  output$table <- renderTable({
    head(data.frame(x=d()))
  })
}

shinyApp(ui=htmlTemplate('/cloud/project/hello/www/index.html'),server)
마지막 줄에 반드시 shinyApp(~)가 들어가야한다

참고
https://shiny.rstudio.com/articles/sliders.html
Shiny - Using sliders
shiny.rstudio.com
'Visualization' 카테고리의 다른 글
| matplotlib 기본 간단하게 (0) | 2024.01.03 |
|---|---|
| 데이터분석 전문가(ADP)를 위한 R프로그래밍 시각화편4 (0) | 2022.02.20 |
| 데이터분석 전문가(ADP)를 위한 R프로그래밍 시각화편3 (0) | 2022.02.19 |
| 데이터분석 전문가(ADP)를 위한 R프로그래밍 시각화편2 (0) | 2022.02.19 |
| 데이터분석 전문가(ADP)를 위한 R프로그래밍 시각화편1 (0) | 2022.02.17 |

