1. 히스토그램
> data(diamonds)

> head(diamonds)
# A tibble: 6 × 10
  carat cut       color clarity depth table price     x     y     z
  <dbl> <ord>     <ord> <ord>   <dbl> <dbl> <int> <dbl> <dbl> <dbl>
1  0.23 Ideal     E     SI2      61.5    55   326  3.95  3.98  2.43
2  0.21 Premium   E     SI1      59.8    61   326  3.89  3.84  2.31
3  0.23 Good      E     VS1      56.9    65   327  4.05  4.07  2.31
4  0.29 Premium   I     VS2      62.4    58   334  4.2   4.23  2.63
5  0.31 Good      J     SI2      63.3    58   335  4.34  4.35  2.75
6  0.24 Very Good J     VVS2     62.8    57   336  3.94  3.96  2.48

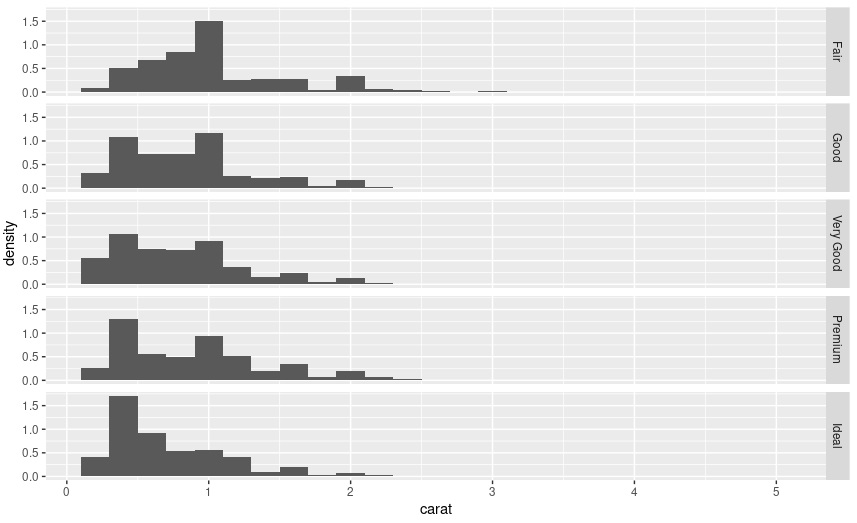
> k <-ggplot(diamonds, aes(carat, ..density..)) + geom_histogram(binwidth=0.2)

> k + facet_grid(.~cut)
carat에 따른 밀도 density의 histogram을 0.2 구간별로 시각화
facet_grid(.~cut)하면 histogram을 cut의 범주별로 세로로 나열함

k + facet_grid(cut~.)
반대로 facet_grid(cut~.)을 하면 cut의 값별로 가로로 히스토그램을 나타냄
2. 막대그래프
ggplot()안에 aes 안에 order=desc(cut)하면 cut을 내림차순으로 정리하여 표시해준다는데
정렬이 안되는데??
geom_bar(aes(order=desc(cut)))하면 order을 무시한다고 나오고
그래서 ggplot안에 했는데 하나 안하나 에러는 없지만 변화가 없음
> w <- ggplot(diamonds, aes(x=clarity, fill=cut,order=desc(cut)))

> w + geom_bar()

3. 선그래프
> df <- data.frame(x=1:10, y=1:10)
> df
    x  y
1   1  1
2   2  2
3   3  3
4   4  4
5   5  5
6   6  6
7   7  7
8   8  8
9   9  9
10 10 10
> f <- ggplot(df, aes(x=x, y=y))
> f + geom_line(linetype=2)
> f + geom_line(linetype='dotdash')
geom_line()안에 linetype 옵션을 주면 선그래프의 선 스타일에 변화를 줄 수 있다

4. 산점도
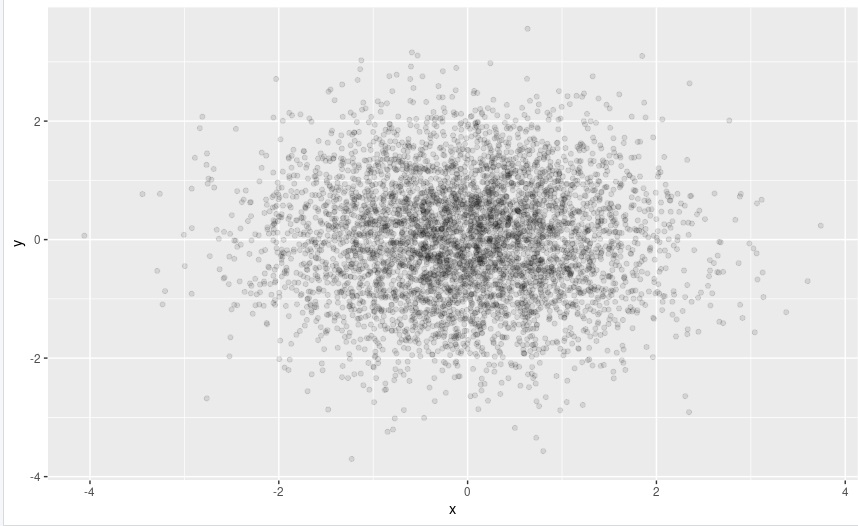
> df <- data.frame(x=rnorm(5000), y = rnorm(5000))
> h <- ggplot(df, aes(x,y))
> h + geom_point()
rnorm()은 평균이 0 표준편차가 1인 정규분포를 따르는 난수를 생성하는 함수
geom_point()로 기본 산점도를 생성

alpha값을 조절하여 점의 투명도를 조절함
어디에 점들이 집중적으로 분포하는지 확인 가능
> h + geom_point(alpha=1/10)
size 옵션은 점의 크기를 변경한다
> data(mtcars)
> head(mtcars)
                   mpg cyl disp  hp drat    wt  qsec vs am gear carb
Mazda RX4         21.0   6  160 110 3.90 2.620 16.46  0  1    4    4
Mazda RX4 Wag     21.0   6  160 110 3.90 2.875 17.02  0  1    4    4
Datsun 710        22.8   4  108  93 3.85 2.320 18.61  1  1    4    1
Hornet 4 Drive    21.4   6  258 110 3.08 3.215 19.44  1  0    3    1
Hornet Sportabout 18.7   8  360 175 3.15 3.440 17.02  0  0    3    2
Valiant           18.1   6  225 105 2.76 3.460 20.22  1  0    3    1

> p <- ggplot(mtcars, aes(wt,mpg))
> p + geom_point(size=4)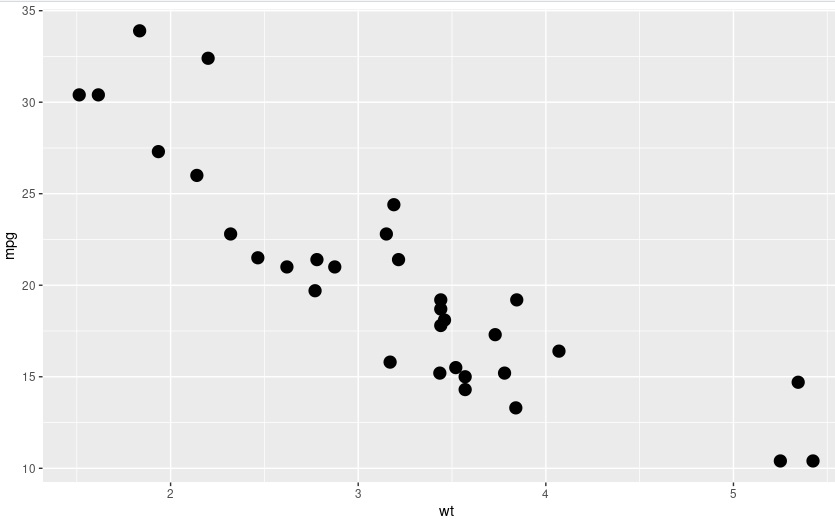
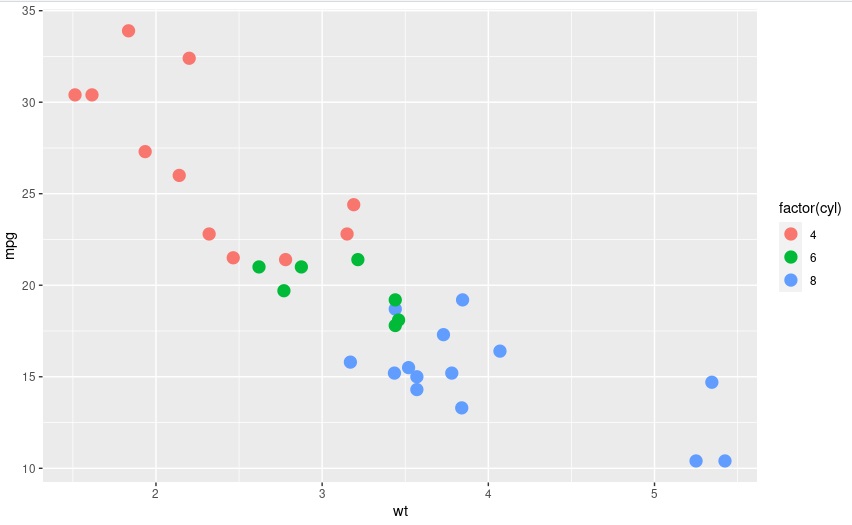
geom_point(aes(colour=factor(cyl)))로 colour안에 지정한 factor변수에 따라 요인별로 점의 색을 다르게 할 수 있다
> p + geom_point(aes(colour=factor(cyl)),size=4)
geom_point(aes(shape=factor(cyl)))로 주면 factor 변수에 따라 요인별로 점의 모양을 다르게 함

반면 geom_point(shape=5)라고 하면 전체 점의 모양을 5번으로 지정한다는 소리

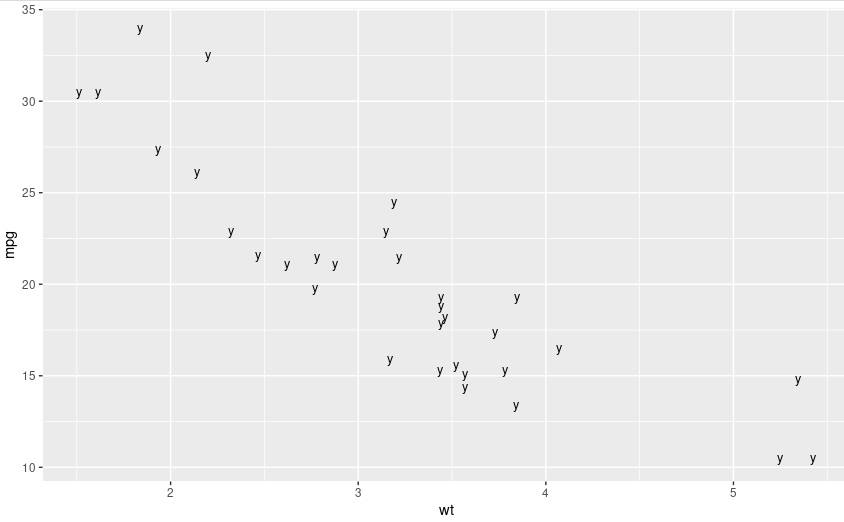
혹은 shape에 직접 문자 모양을 지정할 수 있다
예를 들어 size가 3인 'y' 모양으로 점을 바꾸고 싶다면
> p + geom_point(shape='y',size=3)
geom_point(aes(size=qsec))로 주면 qsec라는 변수 값에 따라 점의 크기를 다르게 표현함
> p <- ggplot(mtcars, aes(wt,mpg))
> p + geom_point(aes(size=qsec))

산점도 내부에 임의의 직선을 삽입할 수 있다
geom_hline(yintercept=25,size=3.5)를 더해주면 산점도에 선의 굵기가 3.5인 y=25를 삽입

shape=NA라고 주면 아무것도 표시하지 않는다
> p + geom_point(shape=NA)

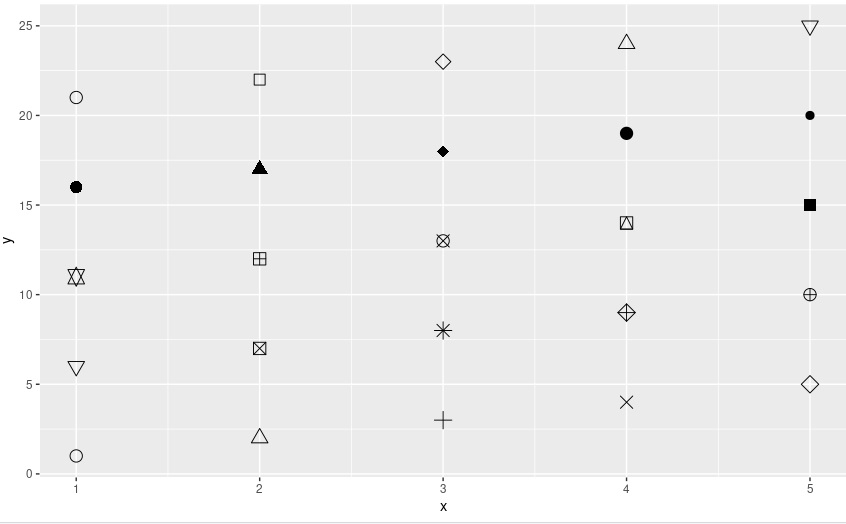
데이터프레임을 적절히 이용하면 여러개의 점의 모양을 한번에 넣을 수도 있다
> df2 <- data.frame(x=1:5, y=1:25, z=1:25)
> s <- ggplot(df2, aes(x,y))
> s + geom_point(aes(shape=z),size=4)+scale_shape_identity()
z=1:25이고 aes(shape=z)로 주면 1번부터 25번까지 점의 모양을 다르게 해서 표시함
산점도 내부에 강조할 특정 영역을 박스로 지정해서 표시할 수 있다
x축의 최소, 최대를 지정하고 y축의 최소, 최대를 지정해서 annotate를 함
> p <- ggplot(mtcars, aes(wt,mpg))+geom_point()
> p + annotate('rect', xmin=2, xmax=3.5, ymin=2, ymax=25, fill='dark grey', alpha=.5)

5. pointrange
선형모델링을 수행하고 나서
예측값의 범위를 geom_pointrange()를 이용해 표시할 수 있다
> dmod <- lm(price~cut, data=diamonds)
> cuts <- data.frame(cut=unique(diamonds$cut), predict(dmod, data.frame(cut=unique(diamonds$cut)),se=TRUE)[c('fit','se.fit')])
> se <- ggplot(cuts, aes(x=cut, y=fit, ymin=fit-se.fit, ymax=fit+se.fit, colour=cut))
> se+geom_pointrange()
cut에 따른 price를 예측하고 예측값을 cuts라는 data.frame으로 생성
예측값은 fit이고 예측오차는 se.fit에 저장되어 예측값의 범위가 fit-se.fit~fit+se.fit이 될거임
이것으로 ggplot을 생성하고 geom_pointrange()를 주면 범위까지 표시할 수 있다

6. 축의 범위 지정
limits를 이용하여 축의 범위를 제한하여 그 부분에서만 그래프를 그린다
> p <- qplot(disp, wt, data=mtcars) + geom_smooth()
> p + scale_x_continuous(limits=c(325,500))

7. boxplot
qplot에서 boxplot을 그릴 수 있다
> qplot(cut, price, data=diamonds, geom='boxplot')

last_plot()은 마지막에 그린 그림을 지정한다
coord_flip()을 더해주면 가로로 눕혀서 boxplot을 그려준다
##qplot(cut, price, data=diamonds, geom='boxplot') + coord_flip()

> last_plot() + coord_flip()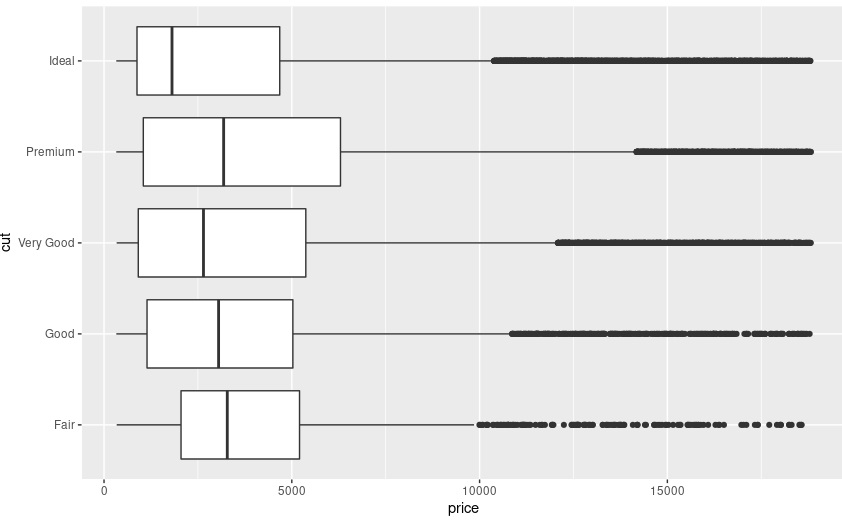
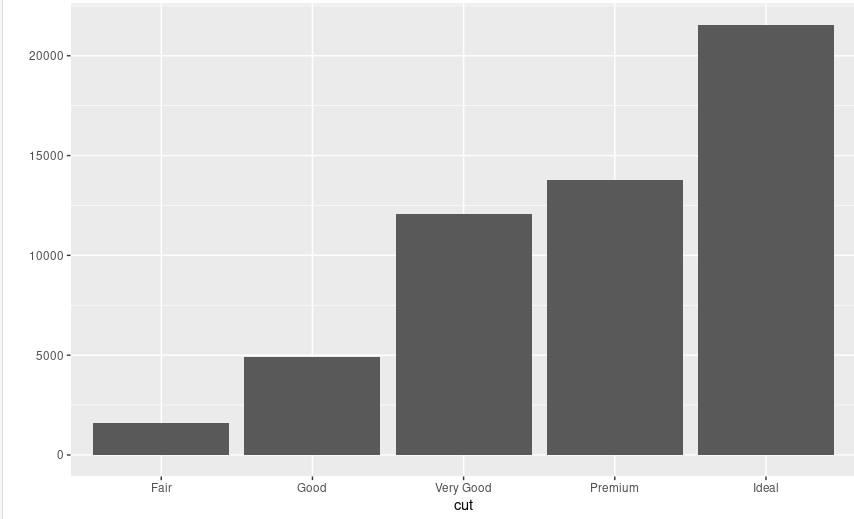
qplot에서 geom에 bar를 지정하면 bar 그래프를 그려준다
> qplot(cut, data=diamonds, geom='bar')
'Visualization' 카테고리의 다른 글
| 데이터분석 전문가(ADP)를 위한 shiny를 활용한 R프로그래밍 시각화 (0) | 2022.02.21 |
|---|---|
| 데이터분석 전문가(ADP)를 위한 R프로그래밍 시각화편4 (0) | 2022.02.20 |
| 데이터분석 전문가(ADP)를 위한 R프로그래밍 시각화편3 (0) | 2022.02.19 |
| 데이터분석 전문가(ADP)를 위한 R프로그래밍 시각화편1 (0) | 2022.02.17 |
| seaborn에서 사용할 수 있는 그래프들 (0) | 2022.02.07 |

